JavaScript/HTML5 charts, JavaScript charts, HTML5 charts, JS charts, Business charts, Charts, Data visualization, Chart libraries, Charting components, Charting libraries, Web Development :: Web Design Utilities, Business graphics, Business & Finance :: Stocks & Portfolios, Business & Finance :: Presentation Tools, Multimedia and Design :: Illustration, Business & Finance :: Misc. Business, Business & Finance :: Project Management, Multimedia and Design :: Presentations, Multimedia Creation Tools, Multimedia and Design :: Utilities, Internet :: Monitoring, Business & Finance :: Spreadsheets, Internet :: Website Management, Programming :: JavaScript, Programming :: Components and Libraries
Платформа:
Web Browser
ОС:
WinXP, Win7 x32, Win7 x64, Windows 8, Windows 10, WinServer, WinOther, WinVista, WinVista x64, Linux, Linux Console, Linux Gnome, Linux GPL, Linux Open Source, Mac OS X, Android, iPhone, iPad, iOS
Системные требования:
None. JavaScript/HTML5 based; compatible with all platforms and browsers.
Trial message on every chart. Trial preloader. No functional limitations.
Ключевые слова: anychart, charts, javascript charts, ajax charts, html5 charts, open charts, line, spline, area, column, bar chart, pie, scatter, gauges, dashboards, plots, js chart, interactive charts, data visualization, sparklines, big data, business intelligence
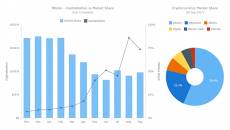
AnyChart is a robust and superfast JavaScript charting library to add great-looking, interactive HTML5 charts into any project, in any browser, and on any platform/OS including mobile ones.
AnyChart provides advanced customization and flexibility opportunities, no matter if you are developing a website, a business intelligence application (BI) for corporate usage, or some software for your clients. Our JavaScript API makes it possible for you to create even big data based charts in real time, with continuous updates and multi-level drill-downs. Moreover, whatever server platform or database you use in your project, AnyChart is ready to fulfill your dream to surprise your customers with amazing informative JS charts and dashboards regardless of device - on Macs, laptops, PCs, smartphones, and tablets.
AnyChart provides scatter, line, bar, area, waterfall, spline, funnel, bubble, polar, column, column range, pie, box plot, linear and angular gauges, area spline range, Mekko, Venn, Sankey Diagram, waterfall, quadrant, tag cloud, and lots of other sorts of charts available separately and in combination, 2D and 3D.
In a nutshell, AnyChart HTML5 chart library's advantages boil down to the following out-of-the-box features: * 60+ chart types; * chart design themes and color palettes; * chart export to PDF, PNG, JPG, SVG, PS, chart data export to CSV and XLSX (Excel), social network sharing; * many web app samples with interactive BI dashboards; * localization engine (194 predefined locale files), as well as advanced interactivity (tooltips on hover, drill-down, exclude data point, multi-selection, and more), multiple axes, async rendering, online chart editor, and much more to easily create beautiful interactive JS data visualization for any web projects.
Client-Side Export is now available in the AnyChart JavaScript charting library. This will allow you to have your data visualizations saved as images — SVG, PNG, and JPG — and PDF documents without a roundtrip to the server by leveraging the built-in browser features for a seamless JS chart export.
Разрешения на распространение: This product can be freely distributed through the Internet. To publish it on a CD, please contact sales@anychart.com.
AnyChart End User License Agreement (AnyChart/AnyMap/AnyGantt/AnyStock)
Notice to user: This is a legal document between you and AnyChart (“ANYCHART”). It is important that you read this document before using the ANYCHART-provided software (“Software”) and any accompanying documentation (“Documentation”). By using the Software, you agree to be bound by the terms of this Agreement whether or not you decide to purchase the Software. If you do not agree, you are not licensed to use the Software, and you must destroy any downloaded copies of the Software in your possession or control.
1. DEFINITIONS: a) “Software” means the AnyChart software described in Exhibit A, in object code form (which may or may not include source code form), including all Updates (as defined below) supplied by AnyChart under this Agreement. b) “Documentation” means the user manuals and similar materials customarily supplied by AnyChart with the Software. c) “Support” means the standard baseline Technical Support Services as set forth in the Support and Maintenance Agreement, including Updates, email support, internal web access, and response priorities set forth herein and an assigned to a Technical Support contact at AnyChart. d) “Major Version Upgrade” means a specific edition of the Software which (i) is similar to and is marked under the same product number and nomenclature as the Software, (ii) is designated by a change in the first digit to the left of the decimal point, and (iii) contains significant functionality changes or improvements. e) “Maintenance or Minor Version Upgrade” means any update, error correction or enhancement of the Software, which is (i) substantially similar to and is marketed under the same product number and nomenclature as the Software, and (ii) designated by a change in the digits to the right of the decimal point. f) “Website License” This license is to be used to show information on the web that is freely accessible by anyone with a web browser. A domain that does NOT require login and or authentication to view content of any sort. g) “Intranet License” This license is designed for those who wish to build applications inside their firewall or for internal consumption among employees. This license is NOT to be used with customers, partners, vendors, or as part of a SaaS or PaaS Website. h) “Corporate License” For use on a Website, Intranet and additionally this license can be used on any site that might require authentication and or login type credentials to access information that is NOT part of a SaaS or PaaS Website. Determined by either the number of Applications or Servers. i) “Enterprise License” For use on a Website, Intranet and additionally this license can be used on any site that might require authentication and or login type credentials to access information that is NOT part of a SaaS or PaaS Website. Determined by either the number of Applications or Servers. j) “SaaS” Any Business website that charges either one time or reoccurring fee's for use of the business websites software and or services. k) “PaaS” Any Business website that charges clients a fee for service in which Software is used to some extent to deliver the goods and or service to the client. l) “OEM” refers to an application or suite of commercial applications built by you to be sold either through direct or other distribution channels to your customers, businesses or consumers and is installed on the customer's premises or infrastructure. m) “Servers” can be an Intranet server, file server, print server, web server, or other. n) “Application (s)” Solutions you build or have built based either on departmental or corporate initiatives hosted either on a Website, Intranet or both. o) “Sample Code” means sample software in source code format designated in the Documentation as “sample code”, “samples,” “sample application code”, and/or “snippets”.
1 SOFTWARE LICENSE 1.1 License Grant ANYCHART grants you a non-exclusive, non-transferable limited license to install and use a copy of the Software on your Intranet and or Website for use by up to the permitted number of Developers. License Type / Number of Developers: Website / 1 Single Developer / 1 Team / 10 1.2 Prohibited Uses No other use is permitted, including without limitation using the Software as part of a SaaS or PaaS Application, or Webhosting services, as part of a distributable commercial Software package or product, framework, component or library regardless of whether you charge a fee, or by any user not licensed to use this copy of the Software through a valid license from ANYCHART. You may not loan, rent, lease, sublicense, distribute or otherwise transfer all or any portion of the Software to third parties. You may not copy the Software except as expressly set forth below, and any copies that you are permitted to make pursuant to this Agreement must contain the same copyright, patent and other intellectual property markings that appear on or in the Software. You may not modify, adapt or translate the Software. You may not, knowingly take any action that would cause the Software to be placed in the public domain; or use the Software in any computer environment not specified in this Agreement. You will comply with applicable law and ANYCHART's instructions regarding the use of the Software. 1.3 Trial Version The trial version of this software may be used for evaluation purposes only at the user's own risk. You are not allowed to use the Trial Version for any application deployment, commercial or production purpose. You may not remove any Trademarks, Watermarks or alter in any way. 1.4 Backup Copies You may make one backup and one archival copy of the Software, provided your backup and archival copies are not installed or used on any computer and further provided that all such copies shall bear the original and unmodified copyright, patent and other intellectual property markings that appear on or in the Software. You may not transfer the rights to a backup or archival copy unless you transfer all rights in the Software as provided under Section 3. 1.5 Download You will receive download instructions when you elect to purchase the Software. The instructions will enable you to activate the Software beyond the watermark trial version. You may not relicense, reproduce or distribute a copy of the code except with the express written permission of ANYCHART. 1.6 Title Title to the Software is not transferred to you. Ownership of all copies of the Software and of copies made by you is vested in ANYCHART, subject to the rights of use granted to you in this Agreement. 1.7 Reverse Engineering You may not reverse engineer, decompile, disassemble or otherwise attempt to discover the source code, underlying ideas, underlying user interface techniques or algorithms of the Software by any means whatsoever, directly or indirectly, or disclose any of the foregoing. Any information supplied by ANYCHART or obtained by you, as permitted hereunder, may only be used by you for the purpose described herein and may not be disclosed to any third party or used to create any software which is substantially similar to the expression of the Software. Requests for information should be directed to the ANYCHART Customer Support Department. 1.8 Ownership By AnyChart Customer shall have no rights with respect to any AnyChart Mark. Any and all goodwill arising from Customers' use of the AnyChart Marks shall inure solely to the benefit of AnyChart. Customer shall not assert any claim to the AnyChart Marks (or any confusingly similar mark) or related goodwill either during or after the Term. If Customer uses any AnyChart Mark in its packaging, marketing, promotional or advertising materials, Customer shall execute such documents as AnyChart may reasonably request from time to time to record or effectuate AnyChart's ownership of the AnyChart Marks and related goodwill. Customer shall not register any AnyChart Mark, or any mark confusingly similar to any AnyChart Mark, in any jurisdiction.
2 INTELLECTUAL PROPERTY RIGHTS You acknowledge that ANYCHART retains the ownership of all patents, copyrights, trade secrets, trademarks and other intellectual property rights pertaining to the Software, and that ANYCHART's ownership rights extend to any images, photographs, animations, videos, audio, music, text and “applets” incorporated into the Software and all accompanying printed materials. You will take no actions, which adversely affect ANYCHART's intellectual property rights in the Software. Trademarks shall be used in accordance with accepted trademark practice, including identification of trademark owners' names. Trademarks may only be used to identify printed output produced by the Software, and such use of any trademark does not give you any right of ownership in that trademark. AnyChart and ANYCHART are trademarks of ANYCHART, LDC. (Registered in multiple countries). Except as expressly stated above, this Agreement does not grant you any intellectual property rights in the Software.
3 LIMITED TRANSFER RIGHTS Notwithstanding the foregoing, you may transfer all your rights to use the Software to another person or legal entity provided that: (a) you also transfer this Agreement, the Software and all other software or hardware bundled or preinstalled with the Software, including all copies, updates and prior versions, and all copies of font software converted into other formats, to such person or entity; (b) you retain no copies, including backups and copies stored on a computer; (c) the receiving party secures download instructions from ANYCHART; and (d) the receiving party accepts the terms and conditions of this Agreement and any other terms and conditions upon which you legally purchased a license to the Software. Notwithstanding the foregoing, you may not transfer education, pre-release, or not-for-resale copies of the Software.
4 WARRANTY AND LIMITATION OF LIABILITY 4.1 Limited Warranty ANYCHART warrants that (a) the Software will perform substantially in accordance with the accompanying written materials for a period of thirty (30) days from the date of receipt. Some states and jurisdictions do not allow limitations on duration of an implied warranty, so the above limitation may not apply to you. To the extent allowed by applicable law, implied warranties on the Software, if any, are limited to thirty (30) days. 4.2 Customer Remedies ANYCHART's and its suppliers' entire liability and your exclusive remedy shall be, at ANYCHART's option, either (a) return of the price paid, if any, or (b) repair or replacement of the Software that does not meet ANYCHART's Limited Warranty and which is returned to ANYCHART with a copy of your receipt. This Limited Warranty is void if failure of the Software has resulted from accident, abuse or misapplication. Any replacement Software will be warranted for the remainder of the original warranty period or thirty (30) days, to be determined by whichever is longer. 4.3 No Other Warranties TO THE MAXIMUM EXTENT PERMITTED BY APPLICABLE LAW, ANYCHART AND ITS SUPPLIERS DISCLAIM ALL OTHER WARRANTIES AND CONDITIONS, EITHER EXPRESS OR IMPLIED, INCLUDING, BUT NOT LIMITED TO, IMPLIED WARRANTIES OF MERCHANTABILITY, FITNESS FOR A PARTICULAR PURPOSE, INFORMATIONAL CONTENT OR ACCURACY, TITLE AND NON-INFRINGEMENT, WITH REGARD TO THE SOFTWARE, AND THE PROVISION OF OR FAILURE TO PROVIDE SUPPORT SERVICES. THIS LIMITED WARRANTY GIVES YOU SPECIFIC LEGAL RIGHTS. YOU MAY HAVE OTHERS, WHICH VARY FROM STATE/JURISDICTION TO STATE/JURISDICTION. 4.4 Limitation Of Liability TO THE MAXIMUM EXTENT PERMITTED BY APPLICABLE LAW, IN NO EVENT SHALL ANYCHART OR ITS SUPPLIERS BE LIABLE FOR ANY SPECIAL, INCIDENTAL, DIRECT, INDIRECT OR CONSEQUENTIAL DAMAGES WHATSOEVER (INCLUDING, WITHOUT LIMITATION, DAMAGES FOR LOSS OF BUSINESS PROFITS, BUSINESS INTERRUPTION, LOSS OF BUSINESS INFORMATION, OR ANY OTHER PECUNIARY LOSS) ARISING OUT OF THE USE OF OR INABILITY TO USE THE SOFTWARE OR THE PROVISION OF OR FAILURE TO PROVIDE SUPPORT SERVICES, EVEN IF ANYCHART HAS BEEN ADVISED OF THE POSSIBILITY OF SUCH DAMAGES. IN ANY CASE, ANYCHART'S ENTIRE LIABILITY UNDER ANY PROVISION OF THIS AGREEMENT SHALL BE LIMITED TO THE GREATER OF THE AMOUNT ACTUALLY PAID BY YOU FOR THE SOFTWARE PRODUCT OR U.S.$50.00.
4.5 Infringement Claims ANYCHART will indemnify and hold you harmless and will defend or settle any claim, suit or proceeding brought against you that is based upon a claim that the content contained in the Software infringes a copyright or violates an intellectual or proprietary right protected by United States or European Union law (“Claim”), but only to the extent the Claim arises directly out of the use of the Software. You must notify ANYCHART in writing of any Claim within ten (10) business days after you first receive notice of the Claim, and you shall provide to ANYCHART at no cost with such assistance and cooperation as ANYCHART may reasonably request from time to time in connection with the defense of the Claim. ANYCHART shall have sole control over any Claim (including, without limitation, the selection of counsel and the right to settle on your behalf on any terms ANYCHART deems desirable in the sole exercise of its discretion). You may, at your sole cost, retain separate counsel and participate in the defense or settlement negotiations. ANYCHART shall pay actual damages and costs awarded against you (or payable by you pursuant to a settlement agreement) in connection with a Claim to the extent such damages and costs are not reimbursed to you by insurance or a third party, to an aggregate maximum of US$1,000. If the Software or its use becomes the subject of a Claim or its use is enjoined, or if in the opinion of ANYCHART's legal counsel the Software is likely to become the subject of a Claim, ANYCHART shall attempt to resolve the Claim by using commercially reasonable efforts to modify the Software or obtain a license to continue using the Software. If in the opinion of ANYCHART's legal counsel the Claim, the injunction or potential Claim cannot be resolved through reasonable modification or licensing, ANYCHART, at its own election, may terminate this Agreement without penalty, and will refund to you on a pro rata basis any fees paid in advance by you to ANYCHART. THE FOREGOING CONSTITUTES ANYCHART'S SOLE AND EXCLUSIVE LIABILITY FOR INTELLECTUAL PROPERTY INFRINGEMENT.
5 TERMINATION This Agreement may be terminated by destroying the software and any copies in your possession. Upon any termination of this Agreement, you must cease all use of the Software, destroy all copies then in your possession or control and take such other actions as ANYCHART may reasonably request to ensure that no copies of the Software remain in your possession or control.
6 GENERAL PROVISIONS 6.1 Governing Law and Jurisdiction This Agreement shall be governed by the laws of the State of California and the Federal laws of the United States of America, exclusive of any conflicts of laws principles, which would require the application of the laws of another jurisdiction. Any and all disputes arising under this Agreement shall be subject to the exclusive jurisdiction of the courts located in Orange County, California. 6.2 Trademark Usage and Publicity Trademark Usage and Publicity. AnyChart may use Licensee's name and logos in its marketing, promotion and website, as is reasonably necessary to describe and promote AnyChart software. 6.3 Entire Agreement This Agreement, including any Exhibits, Schedules or Attachments hereto, sets forth the entire agreement between the parties with respect to the subject matter described herein and supersedes all prior or contemporaneous negotiations, understandings and agreements, whether oral or written between the Parties concerning the subject matter hereof. This Agreement shall also supersede all terms of any additional or unsigned license terms included in any package, media or electronic version of Software provided under this Agreement, including but not limited to any 'shrink wrap', 'click wrap' or 'pop-up' license terms. 6.4 No Amendment This Agreement may not be amended except by means of a written document executed by both Parties. No waiver of any right of either Party will be deemed effective unless that waiver is in writing and is signed by the Party waiving that right. 6.5 Read and Understood Each Party acknowledges that it has read and understands this Agreement and agrees to be bound by its terms. If you do not agree to these conditions you should not install this software.


 Галерея


 AnyChart JS Charts and Dashboards 8.7.0