test
Поиск программ
Язык описания 1 Язык описания 2 Язык описания 3 Язык описания 4 Английский [English] Русский [Russian] Арабский [Arabic] Болгарский [Bulgarian] Китайский [Chinese] Китайский упрощенный [ChineseSimplified] Китайский традиционный [ChineseTraditional] Хорватский [Croatian] Чешский [Czech] Датский [Danish] Голландский [Dutch] Эстонский [Estonian] Финский [Finnish] Французский [French] Грузинский [Georgian] Немецкий [German] Греческий [Greek] Иврит [Hebrew] Хинди [Hindi] Венгерский [Hungarian] Исландский [Icelandic] Индонезийский [Indonesian] Итальянский [Italian] Японский [Japanese] Корейский [Korean] Латышский [Latvian] Литовский [Lithuanian] Норвежский [Norwegian] Персидский [Persian] Польский [Polish] Португальский [Portuguese] Румынский [Romanian] Санскрит [Sanskrit] Сербский [Serbian] Сербохорватский [Serbo-Croatian] Словацкий [Slovak] Словенский [Slovenian] Испанский [Spanish] Шведский [Swedish] Тайский [Thai] Турецкий [Turkish] Украинский [Ukrainian] Afrikaans Albanian Catalan Galician Irish Macedonian Malay Maltese Swahili Vietnamese Welsh Yiddish Armenian Portuguesse Azerbaijani Basque Bengali Esperanto Latin Tamil Telugu Urdu Filipino Belarusian Lao Bosnian Haitian_Creole Chinese_Traditional Chinese_Simplified Multiple Other Gujarati Hausa Javanese Maori Marathi Mongolian Nepali Punjabi Somali Yoruba Zulu Byelorussian Не выбран Любой язык Английский [English] Русский [Russian] Арабский [Arabic] Болгарский [Bulgarian] Китайский [Chinese] Китайский упрощенный [ChineseSimplified] Китайский традиционный [ChineseTraditional] Хорватский [Croatian] Чешский [Czech] Датский [Danish] Голландский [Dutch] Эстонский [Estonian] Финский [Finnish] Французский [French] Грузинский [Georgian] Немецкий [German] Греческий [Greek] Иврит [Hebrew] Хинди [Hindi] Венгерский [Hungarian] Исландский [Icelandic] Индонезийский [Indonesian] Итальянский [Italian] Японский [Japanese] Корейский [Korean] Латышский [Latvian] Литовский [Lithuanian] Норвежский [Norwegian] Персидский [Persian] Польский [Polish] Португальский [Portuguese] Румынский [Romanian] Санскрит [Sanskrit] Сербский [Serbian] Сербохорватский [Serbo-Croatian] Словацкий [Slovak] Словенский [Slovenian] Испанский [Spanish] Шведский [Swedish] Тайский [Thai] Турецкий [Turkish] Украинский [Ukrainian] Afrikaans Albanian Catalan Galician Irish Macedonian Malay Maltese Swahili Vietnamese Welsh Yiddish Armenian Portuguesse Azerbaijani Basque Bengali Esperanto Latin Tamil Telugu Urdu Filipino Belarusian Lao Bosnian Haitian_Creole Chinese_Traditional Chinese_Simplified Multiple Other Gujarati Hausa Javanese Maori Marathi Mongolian Nepali Punjabi Somali Yoruba Zulu Byelorussian Не выбран Любой язык Английский [English] Русский [Russian] Арабский [Arabic] Болгарский [Bulgarian] Китайский [Chinese] Китайский упрощенный [ChineseSimplified] Китайский традиционный [ChineseTraditional] Хорватский [Croatian] Чешский [Czech] Датский [Danish] Голландский [Dutch] Эстонский [Estonian] Финский [Finnish] Французский [French] Грузинский [Georgian] Немецкий [German] Греческий [Greek] Иврит [Hebrew] Хинди [Hindi] Венгерский [Hungarian] Исландский [Icelandic] Индонезийский [Indonesian] Итальянский [Italian] Японский [Japanese] Корейский [Korean] Латышский [Latvian] Литовский [Lithuanian] Норвежский [Norwegian] Персидский [Persian] Польский [Polish] Португальский [Portuguese] Румынский [Romanian] Санскрит [Sanskrit] Сербский [Serbian] Сербохорватский [Serbo-Croatian] Словацкий [Slovak] Словенский [Slovenian] Испанский [Spanish] Шведский [Swedish] Тайский [Thai] Турецкий [Turkish] Украинский [Ukrainian] Afrikaans Albanian Catalan Galician Irish Macedonian Malay Maltese Swahili Vietnamese Welsh Yiddish Armenian Portuguesse Azerbaijani Basque Bengali Esperanto Latin Tamil Telugu Urdu Filipino Belarusian Lao Bosnian Haitian_Creole Chinese_Traditional Chinese_Simplified Multiple Other Gujarati Hausa Javanese Maori Marathi Mongolian Nepali Punjabi Somali Yoruba Zulu Byelorussian Не выбран Любой язык Английский [English] Русский [Russian] Арабский [Arabic] Болгарский [Bulgarian] Китайский [Chinese] Китайский упрощенный [ChineseSimplified] Китайский традиционный [ChineseTraditional] Хорватский [Croatian] Чешский [Czech] Датский [Danish] Голландский [Dutch] Эстонский [Estonian] Финский [Finnish] Французский [French] Грузинский [Georgian] Немецкий [German] Греческий [Greek] Иврит [Hebrew] Хинди [Hindi] Венгерский [Hungarian] Исландский [Icelandic] Индонезийский [Indonesian] Итальянский [Italian] Японский [Japanese] Корейский [Korean] Латышский [Latvian] Литовский [Lithuanian] Норвежский [Norwegian] Персидский [Persian] Польский [Polish] Португальский [Portuguese] Румынский [Romanian] Санскрит [Sanskrit] Сербский [Serbian] Сербохорватский [Serbo-Croatian] Словацкий [Slovak] Словенский [Slovenian] Испанский [Spanish] Шведский [Swedish] Тайский [Thai] Турецкий [Turkish] Украинский [Ukrainian] Afrikaans Albanian Catalan Galician Irish Macedonian Malay Maltese Swahili Vietnamese Welsh Yiddish Armenian Portuguesse Azerbaijani Basque Bengali Esperanto Latin Tamil Telugu Urdu Filipino Belarusian Lao Bosnian Haitian_Creole Chinese_Traditional Chinese_Simplified Multiple Other Gujarati Hausa Javanese Maori Marathi Mongolian Nepali Punjabi Somali Yoruba Zulu Byelorussian
Платформа Лицензия Член ASP Любая платформа [Windows] (10354) [OS X] (898) [Linux] (83) [Android] (107) [iOS] (36) [Web Browser] (112) Любая лицензия Условно-бесплатная [Shareware] (5969) Бесплатная [Freeware] (4609) Рекламная [Adware] (32) Демо [Demo] (853) Коммерческая [Commercial] (111) Только данные [Data Only] (16) Не важно Да (1202) Нет (10391)
Класс Специфика Категория Любой класс Audio & Multimedia (1590) Audio & Multimedia :: Audio Encoders/Decoders (40) Audio & Multimedia :: Audio File Players (55) Audio & Multimedia :: Audio File Recorders (58) Audio & Multimedia :: CD Burners (37) Audio & Multimedia :: CD Players (6) Audio & Multimedia :: Multimedia Creation Tools (76) Audio & Multimedia :: Music Composers (54) Audio & Multimedia :: Other (182) Audio & Multimedia :: Presentation Tools (46) Audio & Multimedia :: Rippers & Converters (537) Audio & Multimedia :: Speech (22) Audio & Multimedia :: Video Tools (477) Business (2003) Business :: Accounting & Finance (265) Business :: Calculators & Converters (95) Business :: Databases & Tools (306) Business :: Helpdesk & Remote PC (10) Business :: Inventory & Barcoding (270) Business :: Investment Tools (31) Business :: Math & Scientific Tools (76) Business :: Office Suites & Tools (500) Business :: Other (170) Business :: PIMS & Calendars (136) Business :: Project Management (104) Business :: Vertical Market Apps (40) Communications (496) Communications :: Chat & Instant Messaging (38) Communications :: Dial Up & Connection Tools (10) Communications :: E-Mail Clients (46) Communications :: E-Mail List Management (44) Communications :: Fax Tools (6) Communications :: Newsgroup Clients (2) Communications :: Other Comms Tools (32) Communications :: Other E-Mail Tools (246) Communications :: Telephony (50) Communications :: Web/Video Cams (22) Desktop (432) Desktop :: Clocks & Alarms (32) Desktop :: Cursors & Fonts (8) Desktop :: Icons (21) Desktop :: Other (63) Desktop :: Screen Savers: Art (7) Desktop :: Screen Savers: Cartoons (10) Desktop :: Screen Savers: Nature (82) Desktop :: Screen Savers: Other (77) Desktop :: Screen Savers: Science (14) Desktop :: Screen Savers: Seasonal (83) Desktop :: Screen Savers: Vehicles (2) Desktop :: Themes & Wallpaper (33) Development (580) Development :: Active X (34) Development :: Basic, VB, VB DotNet (15) Development :: C / C++ / C# (58) Development :: Compilers & Interpreters (14) Development :: Components & Libraries (261) Development :: Debugging (14) Development :: Delphi (31) Development :: Help Tools (11) Development :: Install & Setup (20) Development :: Management & Distribution (21) Development :: Other (71) Development :: Source Editors (30) Education (320) Education :: Computer (11) Education :: Dictionaries (8) Education :: Geography (6) Education :: Kids (13) Education :: Languages (55) Education :: Mathematics (45) Education :: Other (28) Education :: Reference Tools (8) Education :: Science (53) Education :: Teaching & Training Tools (93) Games & Entertainment (921) Games & Entertainment :: Action (154) Games & Entertainment :: Adventure & Roleplay (23) Games & Entertainment :: Arcade (47) Games & Entertainment :: Board (51) Games & Entertainment :: Card (110) Games & Entertainment :: Casino & Gambling (30) Games & Entertainment :: Kids (13) Games & Entertainment :: Online Gaming (9) Games & Entertainment :: Other (86) Games & Entertainment :: Puzzle & Word Games (184) Games & Entertainment :: Simulation (42) Games & Entertainment :: Sports (81) Games & Entertainment :: Strategy & War Games (54) Games & Entertainment :: Tools & Editors (37) Graphic Apps (788) Graphic Apps :: Animation Tools (26) Graphic Apps :: CAD (133) Graphic Apps :: Converters & Optimizers (140) Graphic Apps :: Editors (210) Graphic Apps :: Font Tools (13) Graphic Apps :: Gallery & Cataloging Tools (40) Graphic Apps :: Icon Tools (9) Graphic Apps :: Other (98) Graphic Apps :: Screen Capture (68) Graphic Apps :: Viewers (51) Home & Hobby (240) Home & Hobby :: Astrology/Biorhythms/Mystic (25) Home & Hobby :: Astronomy (2) Home & Hobby :: Cataloging (32) Home & Hobby :: Food & Drink (16) Home & Hobby :: Genealogy (9) Home & Hobby :: Health & Nutrition (40) Home & Hobby :: Other (32) Home & Hobby :: Personal Finance (38) Home & Hobby :: Personal Interest (17) Home & Hobby :: Recreation (11) Home & Hobby :: Religion (18) Network & Internet (610) Network & Internet :: Ad Blockers (17) Network & Internet :: Browser Tools (57) Network & Internet :: Browsers (29) Network & Internet :: Download Managers (72) Network & Internet :: File Sharing/Peer to Peer (82) Network & Internet :: FTP Clients (22) Network & Internet :: Network Monitoring (111) Network & Internet :: Other (71) Network & Internet :: Remote Computing (69) Network & Internet :: Search/Lookup Tools (44) Network & Internet :: Terminal & Telnet Clients (16) Network & Internet :: Timers & Time Synch (8) Network & Internet :: Trace & Ping Tools (12) Security & Privacy (884) Security & Privacy :: Access Control (76) Security & Privacy :: Anti-Spam & Anti-Spy Tools (35) Security & Privacy :: Anti-Virus Tools (102) Security & Privacy :: Covert Surveillance (42) Security & Privacy :: Encryption Tools (160) Security & Privacy :: Other (126) Security & Privacy :: Password Managers (343) Servers (73) Servers :: Firewall & Proxy Servers (18) Servers :: FTP Servers (5) Servers :: Mail Servers (21) Servers :: Other Server Applications (23) Servers :: Web Servers (6) System Utilities (2399) System Utilities :: Automation Tools (103) System Utilities :: Backup & Restore (355) System Utilities :: Benchmarking (9) System Utilities :: Clipboard Tools (23) System Utilities :: File & Disk Management (1126) System Utilities :: File Compression (42) System Utilities :: Launchers & Task Managers (53) System Utilities :: Other (257) System Utilities :: Printer (36) System Utilities :: Registry Tools (28) System Utilities :: Shell Tools (38) System Utilities :: System Maintenance (218) System Utilities :: Text/Document Editors (111) Web Development (254) Web Development :: ASP & PHP (43) Web Development :: E-Commerce (14) Web Development :: Flash Tools (4) Web Development :: HTML Tools (56) Web Development :: Java & JavaScript (37) Web Development :: Log Analysers (4) Web Development :: Other (29) Web Development :: Site Administration (51) Web Development :: Wizards & Components (7) Web Development :: XML/CSS Tools (9) Любая специфика Alarms & Clock Software (2) Audio (469) Audio & Multimedia (1) Board Games (2) Business (659) Business Applications (2) Business,point of sales,sales,retail (1) Business: Manufacturing Resource Planning (1) Business::Databases & Tools (1) Calculators (2) Calendar & Time Management Software (1) CD Burners (1) Clipboard Software (1) Communications (2) Desktop Customization (1) Development Tools (299) Digital Photo Tools (1) DJ Software (1) E-book Software (4) Education (100) Education:Mathematics (1) Empty (7627) Entertainment Software (1) File Compression (5) File Management (1) Games (558) Games Puzzles Rubik's cube (1) Graphic Apps (1) Graphic Apps::Converters & Optimizers (1) Graphics (245) Health & Fitness Software (5) Hobby Software (1) Home/Education (1) Home/Hobby (77) Illustration Software (6) Internet (429) Maintenance & Optimization (1) Math Software (4) Mathematics (1) Media Players (3) Miscellaneous (2) Multimedia/Design (1) Network Utilities (1) Other (1) Other Comms Tools (1) PDF Software (1) Personal Finance Software (1) Rippers & Converting Software (39) Screen Savers (15) Screensavers (2) Social Networking Software (1) Student Tools (10) Sudoku, Crossword & Puzzle Games (1) System Utilities (4) Tools (2) Utilities (908) Utilities - Miscellaneous (3) Video Converters (70) Video Players (8) Любая категория Antivirus Firewall & Spyware (2) Antivirus Firewall & Spyware :: Monitoring Software (2) Applications (1) Applications :: Clocks and timer (1) Audio & Multimedia (68) Audio & Multimedia :: Audio Encoders\/Decoders (1) Audio & Multimedia :: Audio File Players (6) Audio & Multimedia :: Audio File Recorders (13) Audio & Multimedia :: CD Burners (5) Audio & Multimedia :: Jukebox (1) Audio & Multimedia :: Multimedia Creation Tools (4) Audio & Multimedia :: Music Composers (7) Audio & Multimedia :: Other (6) Audio & Multimedia :: Rippers & Converters (7) Audio & Multimedia :: Speech (5) Audio & Multimedia :: Video Tools (13) Audio & Video (2) Audio & Video :: Video (2) Busines (2) Busines :: Accounting & Finance (2) Business (48) Business & Finance (1570) Business & Finance :: Accounting Tools (325) Business & Finance :: Bar Code (1) Business & Finance :: Barcode (1) Business & Finance :: CAD (91) Business & Finance :: CAD-CAM (1) Business & Finance :: Calculators & Converters (101) Business & Finance :: Calculators & Convertors (1) Business & Finance :: Database Managers (148) Business & Finance :: Dental (1) Business & Finance :: E-commerce (64) Business & Finance :: Fax Tools (9) Business & Finance :: Finance Tools (233) Business & Finance :: Help Desk (38) Business & Finance :: Inventory (201) Business & Finance :: Invoice & billing (217) Business & Finance :: Mail Merge (1) Business & Finance :: Manufacturing (1) Business & Finance :: Medical (1) Business & Finance :: Microsoft Word (1) Business & Finance :: Misc. Business (376) Business & Finance :: Office Tools (501) Business & Finance :: Payroll (73) Business & Finance :: PDF Tools (1) Business & Finance :: PIMS & Organizers (111) Business & Finance :: Presentation Tools (99) Business & Finance :: Project Management (164) Business & Finance :: Spreadsheets (176) Business & Finance :: Stocks & Portfolios (49) Business & Finance :: Taxes (21) Business & Finance :: Time Management (1) Business & Finance :: Time Tools (1) Business & Finance :: Utilities (550) Business & Finance :: Vertical Markets (51) Business & Finance :: Vertical Markets :: Shipping (1) Business & Finance :: Vertical Markets :: Transport (1) Business & Finance :: Vertical Markets :: Warehousing (1) Business & Finance :: Word Processing (165) Business & Home (1) Business & Home :: Clocks & Timers (1) Business :: Accounting (1) Business :: Accounting & Finance (10) Business :: Accounting Tools (1) Business :: Applications (1) Business :: Calculators & Converters (6) Business :: Calculators &Converters (2) Business :: Databases & Tools (7) Business :: Finance (1) Business :: General (1) Business :: Inventory & Barcoding (4) Business :: Investment Tools (2) Business :: Math & Scientific Tools (2) Business :: Math &Scientific Tools (1) Business :: Office Suites & Tools (6) Business :: Office Suites& Tools (2) Business :: Other (9) Business :: Project Management (3) Business :: Safety (1) Business :: Social Media Management (1) Business :: Vertical Markets (1) Business :: Word Processing (1) Communication (522) Communication :: Chat Tools (49) Communication :: E-mail (302) Communication :: Fax Tools (7) Communication :: File Delivery (1) Communication :: Instant Messaging (38) Communication :: Misc. Communication (141) Communication :: Remote Control Tools (40) Communication :: Voice/Video Chat (42) Communication :: Wireless Communication (37) Communications (10) Communications :: E-Mail Clients (1) Communications :: Other Comms Tools (2) Communications :: Other E-Mail Tools (1) Communications :: Telephony (6) Computers (1) Computers :: Software (1) Connectivity (3) Connectivity :: Network Monitors (1) Connectivity :: Remote Control (1) Connectivity :: Stay Connected (1) Connectivity :: Winsock Tools (1) Database (2) Database :: Clients (2) Database :: Programming (2) Database :: Utilities (2) Design (1) Design & Photo (2) Design & Photo :: Image Editing (1) Design & Photo :: Viewers & Editors (1) Design :: Image Editing & Viewers (1) Design :: Other design (1) Desktop (10) Desktop :: Alarm/Timer (1) Desktop :: Managers (2) Desktop :: Other (4) Desktop :: Screensaver (2) Desktop :: Screensaver Makers (2) Desktop :: Screensaver Tools (2) Desktop :: Screensavers (2) Desktop :: Themes & Wallpaper (1) Desktop :: Themes & Wallpapers (1) Desktop :: Wallpaper Software (1) Desktop :: Wallpapers (1) Desktop Enhancements (3) Desktop Enhancements :: Screensaver Builders & Tools (2) Desktop Enhancements :: Screensavers (2) Desktop Enhancements :: Screensavers & Wallpaper (1) Desktop Enhancements :: Screensavers :: Editor & Tools (2) Desktop Enhancements :: Wallpaper (1) Desktop Management (1) Desktop Management :: Mouse Tools (1) Developer tools (3) Developer tools :: Libraries & API's (1) Developer Tools :: Miscellaneous Developer Tools (2) Developer tools :: Web Development (2) Development (10) Development :: Basic (2) Development :: C \/ C\+\+ \/ C\# (2) Development :: C/C++/C# (1) Development :: Code Archive (1) Development :: Code Snippets (1) Development :: Components & Libraries (1) Development :: Debugging (3) Development :: Management & Distribution (2) Development :: Source (2) Development :: Source Editors (1) Development :: Utilities (1) Document (1) Document :: Utilities (1) E-mail (3) E-mail :: Clients (1) E-mail :: Mail Servers (1) E-mail :: Misc. Tools (1) E-mail :: Spam Fighters (2) E-mail :: Utilities (1) Education (416) Education :: Astronomy (7) Education :: Collecting (11) Education :: Computer (2) Education :: Computer Tutorial (35) Education :: Data Extraction (1) Education :: Dating (1) Education :: Dictionaries (24) Education :: Electronic books (26) Education :: Engineering (1) Education :: English Language (1) Education :: Foreign languages (1) Education :: Household (3) Education :: Kids (36) Education :: Language (46) Education :: Lesson Management (2) Education :: Management (1) Education :: Mathematics (82) Education :: Music (1) Education :: Others (1) Education :: Reference (34) Education :: Research (1) Education :: Science (96) Education :: Sport and Health (17) Education :: Teaching (131) Education :: Teaching & Training Tools (1) Education :: Timetable (1) Education :: Training Tools (102) Educational software (1) Educational software :: Foreign languages (1) Email (351) Email :: Anti-Spam (14) Email :: Checkers (4) Email :: Clients (151) Email :: En/Decoders (3) Email :: Encryption (12) Email :: Mailing List Tools (172) Email :: Misc. Email Tools (120) Email :: Notification Tools (12) Email :: Server Tools (51) Email :: Signature Tools (6) Email :: Stationery (2) Entertainment (1) Entertainment :: Cybernetics (1) Entertainment :: Dating (1) Fax (1) Fax :: Utilities (1) File Utilities (4) File Utilities :: Disk Cleaners (1) File Utilities :: File Managers (2) File Utilities :: File Splitters (1) File Utilities :: Virus Checkers (2) Firmen & Wirtschaft (1) Firmen & Wirtschaft :: Dienstleistungen (1) Firmen & Wirtschaft :: Dienstleistungen :: Computerbereich (1) Firmen & Wirtschaft :: Dienstleistungen :: Computerbereich :: CAD (1) Games (345) Games & Entertainment (1) Games & Entertainment :: Other (1) Games :: 3D (1) Games :: 3D Games (21) Games :: Action (63) Games :: Adventure (24) Games :: Arcade (43) Games :: Board Games (23) Games :: Card Games (24) Games :: Cards (2) Games :: Casino Type (24) Games :: Cybernetics (1) Games :: Dating (1) Games :: Education & Word (45) Games :: Gaming Tools (29) Games :: Guides (2) Games :: Logic Games (39) Games :: Mods & Scenarios (5) Games :: Online (24) Games :: Patch & Updates (3) Games :: Puzzles (65) Games :: Role Playing (17) Games :: Simulation (38) Games :: Solitaire (3) Games :: Sports (34) Games :: Strategy (2) Games :: Strategy & War (33) Graphic Apps (32) Graphic Apps :: CAD (1) Graphic Apps :: Converters & Optimizers (15) Graphic Apps :: Editors (6) Graphic Apps :: Gallery & CatalogingTools (2) Graphic Apps :: Other (10) Graphic Apps :: Viewers (1) Graphics (9) Graphics & Multimedia (1) Graphics & Multimedia :: Rippers & Converters (1) Graphics :: Animation (3) Graphics :: Animation :: Multimedia (3) Graphics :: Business Graphs (2) Graphics :: Converters (1) Graphics :: Editing Tools (1) Graphics :: Editors (4) Graphics :: Image Editors (1) Graphics :: Other Tools (1) Graphics :: Utilities (6) Graphics :: Viewers (2) Home & Desktop (1) Home & Desktop :: Hobbies (1) Home & Education (1) Home & Education :: Foreign languages (1) Home & Education :: language (1) Home & Education :: languages (1) Home & Hobby (511) Home & Hobby :: Calendars & Planners (60) Home & Hobby :: Cataloging (2) Home & Hobby :: Collection Organizers (1) Home & Hobby :: Education (110) Home & Hobby :: Entertainment (104) Home & Hobby :: Food & Beverage (16) Home & Hobby :: Gambling (21) Home & Hobby :: Genealogy (7) Home & Hobby :: Health & Nutrition (23) Home & Hobby :: Hobbies (100) Home & Hobby :: Home Finance (59) Home & Hobby :: Home Inventory (42) Home & Hobby :: Journals & Diaries (20) Home & Hobby :: Kids & Parenting (25) Home & Hobby :: Misc. Home (114) Home & Hobby :: Other (1) Home & Hobby :: Personal Finance (2) Home & Hobby :: Religion & Spirituality (23) Home & Hobby :: Sports (30) Home & Personal (2) Home & Personal :: Cataloging (2) Home and Education (1) Home and Education :: Language (1) Home and Hobby (2) Home and Hobby :: Cataloging (2) Home and Hobby :: Collection Organizers (1) Home and Hobby :: Hobbies (1) Internet (1165) Internet :: Access Control (72) Internet :: Anti Spam (20) Internet :: ASP (8) Internet :: Browser Utilities (83) Internet :: Browsers (30) Internet :: Communication and Chat (89) Internet :: Connectivity Tools (76) Internet :: DNS Tools (19) Internet :: Download Managers (78) Internet :: Email (232) Internet :: File Sharing Tools (65) Internet :: Firewalls (36) Internet :: Flash Players (1) Internet :: FTP (36) Internet :: HTML5 Players (1) Internet :: ISPs (12) Internet :: Marketing (1) Internet :: Miscellaneous (170) Internet :: Monitoring (124) Internet :: Network Tools (158) Internet :: News Readers (10) Internet :: Online Privacy (82) Internet :: Other (1) Internet :: Pop-Up Ad Killers (14) Internet :: Promotion (59) Internet :: Radio (1) Internet :: Screenscraping (1) Internet :: Search Tools (1) Internet :: Security (172) Internet :: Social Media (1) Internet :: TCP SSL (1) Internet :: Telnet Terminals (14) Internet :: Time Synchronization (8) Internet :: Tools & Utilities (551) Internet :: Usenet Tools (3) Internet :: Video Players (1) Internet :: WAP Utilities (1) Internet :: Website Management (79) Learning Software (1) Learning Software :: Language Software (1) Mac (2) Mac :: Business (2) Mac :: Business :: Databases & Tools (2) MP3 & Audio (528) MP3 & Audio :: All-in-One Jukeboxes (18) MP3 & Audio :: Audio CD Burners (29) MP3 & Audio :: Audio Cleaners (1) MP3 & Audio :: Audio Editors (84) MP3 & Audio :: Audio Recorders (90) MP3 & Audio :: Audio Recordes (3) MP3 & Audio :: Audio Restoration (1) Mp3 & Audio :: CD & DVD Tools (1) MP3 & Audio :: Converters (194) MP3 & Audio :: MIDI Players & Tools (43) MP3 & Audio :: Misc. MP3 & Audio (142) MP3 & Audio :: MP3 Search Tools (29) MP3 & Audio :: Music Creation (59) MP3 & Audio :: Music Management (77) MP3 & Audio :: Noise Removal (2) MP3 & Audio :: Organizers (42) MP3 & Audio :: Players (104) MP3 & Audio :: Rippers & Encoders (94) MP3 & Audio :: Skins (1) MP3 & Audio :: Sound Restoration (1) MP3 & Audio :: Speech Utilities (27) MP3 & Audio :: Streaming Audio (62) MP3 & Audio :: Tag Editor (40) MP3 & Audio :: Utilities and Plug-Ins (83) MP3 & Audio :: Vinyl Restoration (1) MP3 & Audio :: Web Cam Tools (11) Mulimedia & Design (1) Mulimedia & Design :: Video & DVD Tools (1) Multimedia (2) Multimedia & Design (3) Multimedia & Design :: Illustration (1) Multimedia & Design :: Webcam Tools (2) MULTIMEDIA & GRAPHICS (1) MULTIMEDIA & GRAPHICS :: GRAPHIC CONVERSION TOOLS (1) MULTIMEDIA & GRAPHICS :: GRAPHICS EDITORS (1) Multimedia :: Authoring Tools (2) Multimedia and Design (1256) Multimedia and Design :: Animation Tools (63) Multimedia and Design :: Authoring Tools (81) Multimedia and Design :: CAD (120) Multimedia and Design :: Cataloging (45) Multimedia and Design :: Compression (41) Multimedia and Design :: Converters (366) Multimedia and Design :: Drawing (1) Multimedia and Design :: Flash Tools (21) Multimedia and Design :: Fonts & Font Tools (50) Multimedia and Design :: Illustration (89) Multimedia and Design :: Image Analyze (1) Multimedia and Design :: Image Editing (272) Multimedia and Design :: Image Viewers (124) Multimedia and Design :: Miscellaneous (202) Multimedia and Design :: Organizers (66) Multimedia and Design :: Painting (1) Multimedia and Design :: Presentations (94) Multimedia and Design :: Screen Capture (111) Multimedia and Design :: Utilities (356) Multimedia and Design :: verifiers (1) Multimedia and Design :: Video Editors (175) Multimedia and Design :: Video Players (124) Multimedia and Design :: Video Recorders (106) Multimedia and Design :: Video Tools (1) Music (1) Music :: Education (1) Network (1) Network & Internet (14) Network & Internet :: Browser Tools (1) Network & Internet :: File Sharing & Peer to Peer (1) Network & Internet :: File Sharing/Peer to Peer (6) Network & Internet :: FTP Clients (3) Network & Internet :: Other (2) Network & Internet :: Other :: File & Disk Management (1) Network & Internet :: Search/Lookup Tools (1) Network :: Active Directory Manager (1) Network :: Active Directory Reporter (1) Newsgroups (17) Newsgroups :: Image Browsers (6) Newsgroups :: News Readers (7) Newsgroups :: Servers (6) Office Applications (7) Office Applications :: Calendar/Scheduling (2) Office Applications :: Editors (2) Office Applications :: File Managers (1) Office Applications :: Misc. (4) Office Applications :: Spreadsheets (2) Other (5283) Other :: Empty (1856) Other :: Finances & Business (1) Other :: Fixed (742) Other :: Uncommon (3223) Personal Interest (1) Personal Interest :: Hobbies (1) Photo (1) Photo & Graphic (1) Photo & Graphic :: Editors (1) Photo & Graphic :: Editors & Utils (1) Photo & Graphic :: Miscellaneous (1) Photo :: Image Editing (1) Programming (772) Programming :: .NET (150) Programming :: ActiveX (45) Programming :: Bug Trackers (11) Programming :: C & C++ & C# (156) Programming :: calendar calculations (1) Programming :: CGI Tools (2) Programming :: Components and Libraries (261) Programming :: Copy Protection (1) Programming :: Databases (2) Programming :: Databases & Networks (129) Programming :: Debugging (18) Programming :: Delphi (37) Programming :: Distribution Centre Management (1) Programming :: encode/decode (1) Programming :: Enterprise Data Visualization (1) Programming :: Enterprise Resource Planning (1) Programming :: Field Service Management (1) Programming :: Firebird (1) Programming :: FreePascal (2) Programming :: Help Authoring Tools (19) Programming :: holiday calculations (1) Programming :: IDEs & Coding Utilities (86) Programming :: Installers and Uninstallers (14) Programming :: Interbase (1) Programming :: Internet Protocol (1) Programming :: Java (86) Programming :: JavaScript (59) Programming :: Kanban Board (2) Programming :: Lazarus (2) Programming :: library code (1) Programming :: Logistics (1) Programming :: Management and Distribution (31) Programming :: Managemet and Distribution (1) Programming :: Microsoft Access (3) Programming :: Microsoft SQL Server (1) Programming :: Miscellaneous (209) Programming :: MySQL (1) Programming :: Oracle (1) Programming :: Postgre SQL (1) Programming :: Python (16) Programming :: Reference & Tutorials (16) Programming :: Setup Utilities (26) Programming :: Source Code (101) Programming :: Source code generator (1) Programming :: SQL (48) Programming :: SQL Anywhere (1) Programming :: Sybase (1) Programming :: Text Editors (1) Programming :: Tools and Editors (195) Programming :: Utilities (1) Programming :: Visual Basic (113) Programming :: Warehouse Management (1) Programming :: Winsock (1) Science (1) Science :: satellite (1) Science :: satellite :: tracking (1) Security & Privacy (5) Security & Privacy :: Anti-Spam & Anti-Spy Tools (1) Security & Privacy :: Covert Surveillance (2) Security & Privacy :: Encryption Tools (2) Security & Privacy :: Other (1) Security Tools (618) Security Tools :: Anti-Malware (2) Security Tools :: Application Patching (1) Security Tools :: backup (1) Security Tools :: Desktop Monitors (36) Security Tools :: File Removers (59) Security Tools :: File Security (152) Security Tools :: Key Loggers (33) Security Tools :: Online Privacy (123) Security Tools :: Password Generators (47) Security Tools :: Password Managers (90) Security Tools :: Password Recovery (161) Security Tools :: PC Access Control (96) Security Tools :: Personal Firewalls (37) Security Tools :: System Lockers (39) Security Tools :: Traffic Filtering (2) Security Tools :: Virus Removers (49) Security Tools :: Virus Scanners (57) Security Tools :: VPN (4) Servers (1) Servers :: Firewall & Proxy Servers (1) Shell & Desktop Enhancements (300) Shell & Desktop Enhancements :: Cursors (1) Shell & Desktop Enhancements :: Font Tools (15) Shell & Desktop Enhancements :: Fonts (12) Shell & Desktop Enhancements :: Icon Tools (18) Shell & Desktop Enhancements :: Icons (9) Shell & Desktop Enhancements :: Personal Tech Solutions (39) Shell & Desktop Enhancements :: Screensaver Utilities (15) Shell & Desktop Enhancements :: Screensavers (75) Shell & Desktop Enhancements :: Shell & Desktop Management (56) Shell & Desktop Enhancements :: Skins (7) Shell & Desktop Enhancements :: Start-up Screens (8) Shell & Desktop Enhancements :: Themes (7) Shell & Desktop Enhancements :: Utilities (152) Shell & Desktop Enhancements :: Wallpaper (20) Software (1) Software :: Free Software (1) Sports (1) Sports :: Scoreboards (1) System Utilities (43) System Utilities :: Automation (1) System Utilities :: Automation Tools (3) System Utilities :: Backup (1) System Utilities :: Backup & Restore (9) System Utilities :: Configuration (2) System Utilities :: File & Disk Management (3) System Utilities :: File Compression (3) System Utilities :: File Management (6) System Utilities :: Misc. Utilities (5) System Utilities :: Monitors (2) System Utilities :: Other (3) System Utilities :: Printer (2) System Utilities :: Printing (1) System Utilities :: Security (8) System Utilities :: System Maintenance (3) System Utilities :: Taskbar (1) System Utilities :: Undelete (2) Technical (1) Technical :: Computing (1) Unerase (1) Unerase :: Utilities (1) Utilities (2482) Utilities & Drivers (1) Utilities & Drivers :: Shell Tools (1) Utilities & Hardware (2) Utilities & Hardware :: System Utilities (2) Utilities :: Anti-bloatware (1) Utilities :: Antivirus (42) Utilities :: Automation (1) Utilities :: Backup (399) Utilities :: Clipboard Tools (1) Utilities :: Data Recovery (1) Utilities :: Databases (1) Utilities :: disk cleanup software (1) Utilities :: Disk space analysis (1) Utilities :: Disk Space Management (1) Utilities :: Drive space analysis (1) Utilities :: Drive space management (1) Utilities :: Drivers (32) Utilities :: File & Disk Management (881) Utilities :: File age analysis (1) Utilities :: File Compression (97) Utilities :: File editing (1) Utilities :: File size analysis (1) Utilities :: File space analysis (1) Utilities :: File Space Management (1) Utilities :: Folder age analysis (1) Utilities :: Folder analysis (1) Utilities :: Folder size analysis (1) Utilities :: Hard Disk Utilities (1) Utilities :: Installation Monitoring (1) Utilities :: IS/IT Solutions (179) Utilities :: Keyboard (1) Utilities :: Launchers (51) Utilities :: Miscellaneous (569) Utilities :: Mouse & Keyboard (1) Utilities :: Mouse and Keyboard (1) Utilities :: Mouse and Keyboard Utilities (1) Utilities :: Mouse/Keyboard Tools (1) Utilities :: Network Utilities (209) Utilities :: Networking (1) Utilities :: Obsolete file removal (1) Utilities :: Obsolete folder removal (1) Utilities :: Optimizer (1) Utilities :: Password Recovery (166) Utilities :: Ping & Trace Tools (15) Utilities :: Printers (47) Utilities :: Security (1) Utilities :: Security & Encryption (391) Utilities :: Security :: Password Managers (1) Utilities :: Shutdown Tools (26) Utilities :: Synchronization (64) Utilities :: System Diagnostics (115) Utilities :: System Optimizers (150) Utilities :: System Utilities (1089) Utilities :: Uninstallers (34) Video (4) Video & Audio (1) Video & Audio :: Players (1) Video :: Editors (3) Video :: Players (4) Web Authoring (4) Web Authoring :: Tools & Utilities (2) Web Authoring :: Web Utilities (1) Web Authoring :: WYSIWYG Editors (1) Web Development (423) Web Development :: ASP (49) Web Development :: CGI (4) Web Development :: Content Management Systems (1) Web Development :: E-commerce (47) Web Development :: Flat file CMS (1) Web Development :: HTML (1) Web Development :: HTML Conversion Tools (40) Web Development :: HTML Editors (65) Web Development :: HTML Utilities (1) Web Development :: HTML Validators (8) Web Development :: Java & Java Script (70) Web Development :: link checkers (1) Web Development :: Log Analyzers (9) Web Development :: Miscellaneous (138) Web Development :: Other (1) Web Development :: PHP (54) Web Development :: Reference & Tutorials (16) Web Development :: Site Administration (3) Web Development :: Site Management (65) Web Development :: Site Mappers (10) Web Development :: Site Promotion (48) Web Development :: Site Security Tools (14) Web Development :: Style Sheets (16) Web Development :: Web Design Utilities (113) Web Development :: Web Servers (51) Web Development :: XML (22) Web Development :: XML\/CSS Tools (2) Web Surfing (2) Web Surfing :: Security (2) WebDevelopment (2) WebDevelopment :: Log Analysers (2) Windows (12) Windows :: Business (1) Windows :: Business :: Accounting & Finance (1) Windows :: Business :: Business Finance (1) Windows :: Computer Utilities (1) Windows :: Developer Tools (1) Windows :: Developer Tools :: Database (1) Windows :: Development (1) Windows :: Graphic Apps (1) Windows :: Graphic Apps :: CAD (1) Windows :: Graphics (2) Windows :: Graphics :: Paid (2) Windows :: IT/IS (1) Windows :: System Utilities (1) Windows :: System Utilities :: File & Disk Management (1) Windows :: Utilities (1) Windows :: Utilities :: File & Disk Management (1) Windows :: Video Tools (2)
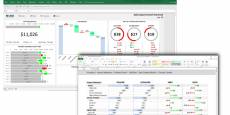
Free Dashboard Add in 20180614
Компания: Airt Ltd Страна: United Kingdom, Lothian, Edinburgh Член ASP: Нет Web сайт компании: https://www.excelawesome.com Сайт программы: https://www.excelawesome.com О приложении: https://www.excelawesome.com/downloads/charts/ Автор: Mike Scobie Email продаж: mike@excelawesome.com Email техподдержки: mike@excelawesome.com Тип лицензии: Бесплатная Класс: Business::Office Suites & Tools Специфика: Категории: Business & Finance :: Spreadsheets, Business & Finance :: Office Tools, Business & Finance :: Accounting Tools, Business & Finance :: Finance Tools Платформа: Windows ОС: Win2000, WinXP, Win7 x32, Win7 x64, Windows 8, Windows 10, WinServer, WinOther, WinVista, WinVista x64 Системные требования: Excel 2010 or Later (Windows Version Only) Язык: English Ограничения: All Dashboard Chart Tools Fully Functional
Ключевые слова: excel, add-in, dashboard, charts, tools, waterfall, progress, ring, gauge, gantt, lollipop, variance
Сообщить о VT
Дата Версия Статус История выпусков 14.06.2018 20180614 New Release New release
Разрешения на распространение: Distribution Permissions of FREE DASHBOARD ADD-IN The unregistered shareware version of FREE DASHBOARD ADD-IN may be freely distributed, provided the distribution package is not modified. No person or company may charge a fee for the distribution of AIRT ADD IN without written permission from the copyright holder, AIRT LTD. Allowed distribution includes, but is not limited to, shareware repositories, internet download sites, shareware CD-ROM compilations, friends, co-workers, BBS sites, magazine cover CD-ROMs. If you include the software on a CD-ROM we appreciate to get a copy of the CD-ROM. You can also send us a notification email at info@excelawesome.com
Лицензионное соглашение с конечным пользователем END-USER LICENSE AGREEMENT FOR “Airt”. IMPORTANT PLEASE READ THE TERMS AND CONDITIONS OF THIS LICENSE AGREEMENT CAREFULLY BEFORE CONTINUING WITH THIS PROGRAM INSTALL: AIRT LTD End-User License Agreement ('EULA') is a legal agreement between you (either an individual or a single entity) and AIRT LTD for the AIRT LTD software product(s) identified above which may include associated software components, media, printed materials, and 'online' or electronic documentation ('SOFTWARE PRODUCT'). By installing, copying, or otherwise using the SOFTWARE PRODUCT, you agree to be bound by the terms of this EULA. This license agreement represents the entire agreement concerning the program between you and AIRT LTD, (referred to as 'licenser'), and it supersedes any prior proposal, representation, or understanding between the parties. If you do not agree to the terms of this EULA, do not install or use the SOFTWARE PRODUCT.
Рейтинг:
Назад Наверх
Июль 2025
Пн Вт Ср Чт Пт Сб Вс
1 2 3 4 5 6
7 8 9 10 11 12 13
14 15 16 17 18 19 20
21 22 23 24 25 26 27
28 29 30 31
31 июля 2025 года, четверг
Сейчас на сайте
Гостей: 25


 Галерея


 Free Dashboard Add in 20180614