test
Поиск программ
Язык описания 1 Язык описания 2 Язык описания 3 Язык описания 4 Английский [English] Русский [Russian] Арабский [Arabic] Болгарский [Bulgarian] Китайский [Chinese] Китайский упрощенный [ChineseSimplified] Китайский традиционный [ChineseTraditional] Хорватский [Croatian] Чешский [Czech] Датский [Danish] Голландский [Dutch] Эстонский [Estonian] Финский [Finnish] Французский [French] Грузинский [Georgian] Немецкий [German] Греческий [Greek] Иврит [Hebrew] Хинди [Hindi] Венгерский [Hungarian] Исландский [Icelandic] Индонезийский [Indonesian] Итальянский [Italian] Японский [Japanese] Корейский [Korean] Латышский [Latvian] Литовский [Lithuanian] Норвежский [Norwegian] Персидский [Persian] Польский [Polish] Португальский [Portuguese] Румынский [Romanian] Санскрит [Sanskrit] Сербский [Serbian] Сербохорватский [Serbo-Croatian] Словацкий [Slovak] Словенский [Slovenian] Испанский [Spanish] Шведский [Swedish] Тайский [Thai] Турецкий [Turkish] Украинский [Ukrainian] Afrikaans Albanian Catalan Galician Irish Macedonian Malay Maltese Swahili Vietnamese Welsh Yiddish Armenian Portuguesse Azerbaijani Basque Bengali Esperanto Latin Tamil Telugu Urdu Filipino Belarusian Lao Bosnian Haitian_Creole Chinese_Traditional Chinese_Simplified Multiple Other Gujarati Hausa Javanese Maori Marathi Mongolian Nepali Punjabi Somali Yoruba Zulu Byelorussian Не выбран Любой язык Английский [English] Русский [Russian] Арабский [Arabic] Болгарский [Bulgarian] Китайский [Chinese] Китайский упрощенный [ChineseSimplified] Китайский традиционный [ChineseTraditional] Хорватский [Croatian] Чешский [Czech] Датский [Danish] Голландский [Dutch] Эстонский [Estonian] Финский [Finnish] Французский [French] Грузинский [Georgian] Немецкий [German] Греческий [Greek] Иврит [Hebrew] Хинди [Hindi] Венгерский [Hungarian] Исландский [Icelandic] Индонезийский [Indonesian] Итальянский [Italian] Японский [Japanese] Корейский [Korean] Латышский [Latvian] Литовский [Lithuanian] Норвежский [Norwegian] Персидский [Persian] Польский [Polish] Португальский [Portuguese] Румынский [Romanian] Санскрит [Sanskrit] Сербский [Serbian] Сербохорватский [Serbo-Croatian] Словацкий [Slovak] Словенский [Slovenian] Испанский [Spanish] Шведский [Swedish] Тайский [Thai] Турецкий [Turkish] Украинский [Ukrainian] Afrikaans Albanian Catalan Galician Irish Macedonian Malay Maltese Swahili Vietnamese Welsh Yiddish Armenian Portuguesse Azerbaijani Basque Bengali Esperanto Latin Tamil Telugu Urdu Filipino Belarusian Lao Bosnian Haitian_Creole Chinese_Traditional Chinese_Simplified Multiple Other Gujarati Hausa Javanese Maori Marathi Mongolian Nepali Punjabi Somali Yoruba Zulu Byelorussian Не выбран Любой язык Английский [English] Русский [Russian] Арабский [Arabic] Болгарский [Bulgarian] Китайский [Chinese] Китайский упрощенный [ChineseSimplified] Китайский традиционный [ChineseTraditional] Хорватский [Croatian] Чешский [Czech] Датский [Danish] Голландский [Dutch] Эстонский [Estonian] Финский [Finnish] Французский [French] Грузинский [Georgian] Немецкий [German] Греческий [Greek] Иврит [Hebrew] Хинди [Hindi] Венгерский [Hungarian] Исландский [Icelandic] Индонезийский [Indonesian] Итальянский [Italian] Японский [Japanese] Корейский [Korean] Латышский [Latvian] Литовский [Lithuanian] Норвежский [Norwegian] Персидский [Persian] Польский [Polish] Португальский [Portuguese] Румынский [Romanian] Санскрит [Sanskrit] Сербский [Serbian] Сербохорватский [Serbo-Croatian] Словацкий [Slovak] Словенский [Slovenian] Испанский [Spanish] Шведский [Swedish] Тайский [Thai] Турецкий [Turkish] Украинский [Ukrainian] Afrikaans Albanian Catalan Galician Irish Macedonian Malay Maltese Swahili Vietnamese Welsh Yiddish Armenian Portuguesse Azerbaijani Basque Bengali Esperanto Latin Tamil Telugu Urdu Filipino Belarusian Lao Bosnian Haitian_Creole Chinese_Traditional Chinese_Simplified Multiple Other Gujarati Hausa Javanese Maori Marathi Mongolian Nepali Punjabi Somali Yoruba Zulu Byelorussian Не выбран Любой язык Английский [English] Русский [Russian] Арабский [Arabic] Болгарский [Bulgarian] Китайский [Chinese] Китайский упрощенный [ChineseSimplified] Китайский традиционный [ChineseTraditional] Хорватский [Croatian] Чешский [Czech] Датский [Danish] Голландский [Dutch] Эстонский [Estonian] Финский [Finnish] Французский [French] Грузинский [Georgian] Немецкий [German] Греческий [Greek] Иврит [Hebrew] Хинди [Hindi] Венгерский [Hungarian] Исландский [Icelandic] Индонезийский [Indonesian] Итальянский [Italian] Японский [Japanese] Корейский [Korean] Латышский [Latvian] Литовский [Lithuanian] Норвежский [Norwegian] Персидский [Persian] Польский [Polish] Португальский [Portuguese] Румынский [Romanian] Санскрит [Sanskrit] Сербский [Serbian] Сербохорватский [Serbo-Croatian] Словацкий [Slovak] Словенский [Slovenian] Испанский [Spanish] Шведский [Swedish] Тайский [Thai] Турецкий [Turkish] Украинский [Ukrainian] Afrikaans Albanian Catalan Galician Irish Macedonian Malay Maltese Swahili Vietnamese Welsh Yiddish Armenian Portuguesse Azerbaijani Basque Bengali Esperanto Latin Tamil Telugu Urdu Filipino Belarusian Lao Bosnian Haitian_Creole Chinese_Traditional Chinese_Simplified Multiple Other Gujarati Hausa Javanese Maori Marathi Mongolian Nepali Punjabi Somali Yoruba Zulu Byelorussian
Платформа Лицензия Член ASP Любая платформа [Windows] (10354) [OS X] (898) [Linux] (83) [Android] (107) [iOS] (36) [Web Browser] (112) Любая лицензия Условно-бесплатная [Shareware] (5969) Бесплатная [Freeware] (4609) Рекламная [Adware] (32) Демо [Demo] (853) Коммерческая [Commercial] (111) Только данные [Data Only] (16) Не важно Да (1202) Нет (10391)
Класс Специфика Категория Любой класс Audio & Multimedia (1590) Audio & Multimedia :: Audio Encoders/Decoders (40) Audio & Multimedia :: Audio File Players (55) Audio & Multimedia :: Audio File Recorders (58) Audio & Multimedia :: CD Burners (37) Audio & Multimedia :: CD Players (6) Audio & Multimedia :: Multimedia Creation Tools (76) Audio & Multimedia :: Music Composers (54) Audio & Multimedia :: Other (182) Audio & Multimedia :: Presentation Tools (46) Audio & Multimedia :: Rippers & Converters (537) Audio & Multimedia :: Speech (22) Audio & Multimedia :: Video Tools (477) Business (2003) Business :: Accounting & Finance (265) Business :: Calculators & Converters (95) Business :: Databases & Tools (306) Business :: Helpdesk & Remote PC (10) Business :: Inventory & Barcoding (270) Business :: Investment Tools (31) Business :: Math & Scientific Tools (76) Business :: Office Suites & Tools (500) Business :: Other (170) Business :: PIMS & Calendars (136) Business :: Project Management (104) Business :: Vertical Market Apps (40) Communications (496) Communications :: Chat & Instant Messaging (38) Communications :: Dial Up & Connection Tools (10) Communications :: E-Mail Clients (46) Communications :: E-Mail List Management (44) Communications :: Fax Tools (6) Communications :: Newsgroup Clients (2) Communications :: Other Comms Tools (32) Communications :: Other E-Mail Tools (246) Communications :: Telephony (50) Communications :: Web/Video Cams (22) Desktop (432) Desktop :: Clocks & Alarms (32) Desktop :: Cursors & Fonts (8) Desktop :: Icons (21) Desktop :: Other (63) Desktop :: Screen Savers: Art (7) Desktop :: Screen Savers: Cartoons (10) Desktop :: Screen Savers: Nature (82) Desktop :: Screen Savers: Other (77) Desktop :: Screen Savers: Science (14) Desktop :: Screen Savers: Seasonal (83) Desktop :: Screen Savers: Vehicles (2) Desktop :: Themes & Wallpaper (33) Development (580) Development :: Active X (34) Development :: Basic, VB, VB DotNet (15) Development :: C / C++ / C# (58) Development :: Compilers & Interpreters (14) Development :: Components & Libraries (261) Development :: Debugging (14) Development :: Delphi (31) Development :: Help Tools (11) Development :: Install & Setup (20) Development :: Management & Distribution (21) Development :: Other (71) Development :: Source Editors (30) Education (320) Education :: Computer (11) Education :: Dictionaries (8) Education :: Geography (6) Education :: Kids (13) Education :: Languages (55) Education :: Mathematics (45) Education :: Other (28) Education :: Reference Tools (8) Education :: Science (53) Education :: Teaching & Training Tools (93) Games & Entertainment (921) Games & Entertainment :: Action (154) Games & Entertainment :: Adventure & Roleplay (23) Games & Entertainment :: Arcade (47) Games & Entertainment :: Board (51) Games & Entertainment :: Card (110) Games & Entertainment :: Casino & Gambling (30) Games & Entertainment :: Kids (13) Games & Entertainment :: Online Gaming (9) Games & Entertainment :: Other (86) Games & Entertainment :: Puzzle & Word Games (184) Games & Entertainment :: Simulation (42) Games & Entertainment :: Sports (81) Games & Entertainment :: Strategy & War Games (54) Games & Entertainment :: Tools & Editors (37) Graphic Apps (788) Graphic Apps :: Animation Tools (26) Graphic Apps :: CAD (133) Graphic Apps :: Converters & Optimizers (140) Graphic Apps :: Editors (210) Graphic Apps :: Font Tools (13) Graphic Apps :: Gallery & Cataloging Tools (40) Graphic Apps :: Icon Tools (9) Graphic Apps :: Other (98) Graphic Apps :: Screen Capture (68) Graphic Apps :: Viewers (51) Home & Hobby (240) Home & Hobby :: Astrology/Biorhythms/Mystic (25) Home & Hobby :: Astronomy (2) Home & Hobby :: Cataloging (32) Home & Hobby :: Food & Drink (16) Home & Hobby :: Genealogy (9) Home & Hobby :: Health & Nutrition (40) Home & Hobby :: Other (32) Home & Hobby :: Personal Finance (38) Home & Hobby :: Personal Interest (17) Home & Hobby :: Recreation (11) Home & Hobby :: Religion (18) Network & Internet (610) Network & Internet :: Ad Blockers (17) Network & Internet :: Browser Tools (57) Network & Internet :: Browsers (29) Network & Internet :: Download Managers (72) Network & Internet :: File Sharing/Peer to Peer (82) Network & Internet :: FTP Clients (22) Network & Internet :: Network Monitoring (111) Network & Internet :: Other (71) Network & Internet :: Remote Computing (69) Network & Internet :: Search/Lookup Tools (44) Network & Internet :: Terminal & Telnet Clients (16) Network & Internet :: Timers & Time Synch (8) Network & Internet :: Trace & Ping Tools (12) Security & Privacy (884) Security & Privacy :: Access Control (76) Security & Privacy :: Anti-Spam & Anti-Spy Tools (35) Security & Privacy :: Anti-Virus Tools (102) Security & Privacy :: Covert Surveillance (42) Security & Privacy :: Encryption Tools (160) Security & Privacy :: Other (126) Security & Privacy :: Password Managers (343) Servers (73) Servers :: Firewall & Proxy Servers (18) Servers :: FTP Servers (5) Servers :: Mail Servers (21) Servers :: Other Server Applications (23) Servers :: Web Servers (6) System Utilities (2399) System Utilities :: Automation Tools (103) System Utilities :: Backup & Restore (355) System Utilities :: Benchmarking (9) System Utilities :: Clipboard Tools (23) System Utilities :: File & Disk Management (1126) System Utilities :: File Compression (42) System Utilities :: Launchers & Task Managers (53) System Utilities :: Other (257) System Utilities :: Printer (36) System Utilities :: Registry Tools (28) System Utilities :: Shell Tools (38) System Utilities :: System Maintenance (218) System Utilities :: Text/Document Editors (111) Web Development (254) Web Development :: ASP & PHP (43) Web Development :: E-Commerce (14) Web Development :: Flash Tools (4) Web Development :: HTML Tools (56) Web Development :: Java & JavaScript (37) Web Development :: Log Analysers (4) Web Development :: Other (29) Web Development :: Site Administration (51) Web Development :: Wizards & Components (7) Web Development :: XML/CSS Tools (9) Любая специфика Alarms & Clock Software (2) Audio (469) Audio & Multimedia (1) Board Games (2) Business (659) Business Applications (2) Business,point of sales,sales,retail (1) Business: Manufacturing Resource Planning (1) Business::Databases & Tools (1) Calculators (2) Calendar & Time Management Software (1) CD Burners (1) Clipboard Software (1) Communications (2) Desktop Customization (1) Development Tools (299) Digital Photo Tools (1) DJ Software (1) E-book Software (4) Education (100) Education:Mathematics (1) Empty (7627) Entertainment Software (1) File Compression (5) File Management (1) Games (558) Games Puzzles Rubik's cube (1) Graphic Apps (1) Graphic Apps::Converters & Optimizers (1) Graphics (245) Health & Fitness Software (5) Hobby Software (1) Home/Education (1) Home/Hobby (77) Illustration Software (6) Internet (429) Maintenance & Optimization (1) Math Software (4) Mathematics (1) Media Players (3) Miscellaneous (2) Multimedia/Design (1) Network Utilities (1) Other (1) Other Comms Tools (1) PDF Software (1) Personal Finance Software (1) Rippers & Converting Software (39) Screen Savers (15) Screensavers (2) Social Networking Software (1) Student Tools (10) Sudoku, Crossword & Puzzle Games (1) System Utilities (4) Tools (2) Utilities (908) Utilities - Miscellaneous (3) Video Converters (70) Video Players (8) Любая категория Antivirus Firewall & Spyware (2) Antivirus Firewall & Spyware :: Monitoring Software (2) Applications (1) Applications :: Clocks and timer (1) Audio & Multimedia (68) Audio & Multimedia :: Audio Encoders\/Decoders (1) Audio & Multimedia :: Audio File Players (6) Audio & Multimedia :: Audio File Recorders (13) Audio & Multimedia :: CD Burners (5) Audio & Multimedia :: Jukebox (1) Audio & Multimedia :: Multimedia Creation Tools (4) Audio & Multimedia :: Music Composers (7) Audio & Multimedia :: Other (6) Audio & Multimedia :: Rippers & Converters (7) Audio & Multimedia :: Speech (5) Audio & Multimedia :: Video Tools (13) Audio & Video (2) Audio & Video :: Video (2) Busines (2) Busines :: Accounting & Finance (2) Business (48) Business & Finance (1570) Business & Finance :: Accounting Tools (325) Business & Finance :: Bar Code (1) Business & Finance :: Barcode (1) Business & Finance :: CAD (91) Business & Finance :: CAD-CAM (1) Business & Finance :: Calculators & Converters (101) Business & Finance :: Calculators & Convertors (1) Business & Finance :: Database Managers (148) Business & Finance :: Dental (1) Business & Finance :: E-commerce (64) Business & Finance :: Fax Tools (9) Business & Finance :: Finance Tools (233) Business & Finance :: Help Desk (38) Business & Finance :: Inventory (201) Business & Finance :: Invoice & billing (217) Business & Finance :: Mail Merge (1) Business & Finance :: Manufacturing (1) Business & Finance :: Medical (1) Business & Finance :: Microsoft Word (1) Business & Finance :: Misc. Business (376) Business & Finance :: Office Tools (501) Business & Finance :: Payroll (73) Business & Finance :: PDF Tools (1) Business & Finance :: PIMS & Organizers (111) Business & Finance :: Presentation Tools (99) Business & Finance :: Project Management (164) Business & Finance :: Spreadsheets (176) Business & Finance :: Stocks & Portfolios (49) Business & Finance :: Taxes (21) Business & Finance :: Time Management (1) Business & Finance :: Time Tools (1) Business & Finance :: Utilities (550) Business & Finance :: Vertical Markets (51) Business & Finance :: Vertical Markets :: Shipping (1) Business & Finance :: Vertical Markets :: Transport (1) Business & Finance :: Vertical Markets :: Warehousing (1) Business & Finance :: Word Processing (165) Business & Home (1) Business & Home :: Clocks & Timers (1) Business :: Accounting (1) Business :: Accounting & Finance (10) Business :: Accounting Tools (1) Business :: Applications (1) Business :: Calculators & Converters (6) Business :: Calculators &Converters (2) Business :: Databases & Tools (7) Business :: Finance (1) Business :: General (1) Business :: Inventory & Barcoding (4) Business :: Investment Tools (2) Business :: Math & Scientific Tools (2) Business :: Math &Scientific Tools (1) Business :: Office Suites & Tools (6) Business :: Office Suites& Tools (2) Business :: Other (9) Business :: Project Management (3) Business :: Safety (1) Business :: Social Media Management (1) Business :: Vertical Markets (1) Business :: Word Processing (1) Communication (522) Communication :: Chat Tools (49) Communication :: E-mail (302) Communication :: Fax Tools (7) Communication :: File Delivery (1) Communication :: Instant Messaging (38) Communication :: Misc. Communication (141) Communication :: Remote Control Tools (40) Communication :: Voice/Video Chat (42) Communication :: Wireless Communication (37) Communications (10) Communications :: E-Mail Clients (1) Communications :: Other Comms Tools (2) Communications :: Other E-Mail Tools (1) Communications :: Telephony (6) Computers (1) Computers :: Software (1) Connectivity (3) Connectivity :: Network Monitors (1) Connectivity :: Remote Control (1) Connectivity :: Stay Connected (1) Connectivity :: Winsock Tools (1) Database (2) Database :: Clients (2) Database :: Programming (2) Database :: Utilities (2) Design (1) Design & Photo (2) Design & Photo :: Image Editing (1) Design & Photo :: Viewers & Editors (1) Design :: Image Editing & Viewers (1) Design :: Other design (1) Desktop (10) Desktop :: Alarm/Timer (1) Desktop :: Managers (2) Desktop :: Other (4) Desktop :: Screensaver (2) Desktop :: Screensaver Makers (2) Desktop :: Screensaver Tools (2) Desktop :: Screensavers (2) Desktop :: Themes & Wallpaper (1) Desktop :: Themes & Wallpapers (1) Desktop :: Wallpaper Software (1) Desktop :: Wallpapers (1) Desktop Enhancements (3) Desktop Enhancements :: Screensaver Builders & Tools (2) Desktop Enhancements :: Screensavers (2) Desktop Enhancements :: Screensavers & Wallpaper (1) Desktop Enhancements :: Screensavers :: Editor & Tools (2) Desktop Enhancements :: Wallpaper (1) Desktop Management (1) Desktop Management :: Mouse Tools (1) Developer tools (3) Developer tools :: Libraries & API's (1) Developer Tools :: Miscellaneous Developer Tools (2) Developer tools :: Web Development (2) Development (10) Development :: Basic (2) Development :: C \/ C\+\+ \/ C\# (2) Development :: C/C++/C# (1) Development :: Code Archive (1) Development :: Code Snippets (1) Development :: Components & Libraries (1) Development :: Debugging (3) Development :: Management & Distribution (2) Development :: Source (2) Development :: Source Editors (1) Development :: Utilities (1) Document (1) Document :: Utilities (1) E-mail (3) E-mail :: Clients (1) E-mail :: Mail Servers (1) E-mail :: Misc. Tools (1) E-mail :: Spam Fighters (2) E-mail :: Utilities (1) Education (416) Education :: Astronomy (7) Education :: Collecting (11) Education :: Computer (2) Education :: Computer Tutorial (35) Education :: Data Extraction (1) Education :: Dating (1) Education :: Dictionaries (24) Education :: Electronic books (26) Education :: Engineering (1) Education :: English Language (1) Education :: Foreign languages (1) Education :: Household (3) Education :: Kids (36) Education :: Language (46) Education :: Lesson Management (2) Education :: Management (1) Education :: Mathematics (82) Education :: Music (1) Education :: Others (1) Education :: Reference (34) Education :: Research (1) Education :: Science (96) Education :: Sport and Health (17) Education :: Teaching (131) Education :: Teaching & Training Tools (1) Education :: Timetable (1) Education :: Training Tools (102) Educational software (1) Educational software :: Foreign languages (1) Email (351) Email :: Anti-Spam (14) Email :: Checkers (4) Email :: Clients (151) Email :: En/Decoders (3) Email :: Encryption (12) Email :: Mailing List Tools (172) Email :: Misc. Email Tools (120) Email :: Notification Tools (12) Email :: Server Tools (51) Email :: Signature Tools (6) Email :: Stationery (2) Entertainment (1) Entertainment :: Cybernetics (1) Entertainment :: Dating (1) Fax (1) Fax :: Utilities (1) File Utilities (4) File Utilities :: Disk Cleaners (1) File Utilities :: File Managers (2) File Utilities :: File Splitters (1) File Utilities :: Virus Checkers (2) Firmen & Wirtschaft (1) Firmen & Wirtschaft :: Dienstleistungen (1) Firmen & Wirtschaft :: Dienstleistungen :: Computerbereich (1) Firmen & Wirtschaft :: Dienstleistungen :: Computerbereich :: CAD (1) Games (345) Games & Entertainment (1) Games & Entertainment :: Other (1) Games :: 3D (1) Games :: 3D Games (21) Games :: Action (63) Games :: Adventure (24) Games :: Arcade (43) Games :: Board Games (23) Games :: Card Games (24) Games :: Cards (2) Games :: Casino Type (24) Games :: Cybernetics (1) Games :: Dating (1) Games :: Education & Word (45) Games :: Gaming Tools (29) Games :: Guides (2) Games :: Logic Games (39) Games :: Mods & Scenarios (5) Games :: Online (24) Games :: Patch & Updates (3) Games :: Puzzles (65) Games :: Role Playing (17) Games :: Simulation (38) Games :: Solitaire (3) Games :: Sports (34) Games :: Strategy (2) Games :: Strategy & War (33) Graphic Apps (32) Graphic Apps :: CAD (1) Graphic Apps :: Converters & Optimizers (15) Graphic Apps :: Editors (6) Graphic Apps :: Gallery & CatalogingTools (2) Graphic Apps :: Other (10) Graphic Apps :: Viewers (1) Graphics (9) Graphics & Multimedia (1) Graphics & Multimedia :: Rippers & Converters (1) Graphics :: Animation (3) Graphics :: Animation :: Multimedia (3) Graphics :: Business Graphs (2) Graphics :: Converters (1) Graphics :: Editing Tools (1) Graphics :: Editors (4) Graphics :: Image Editors (1) Graphics :: Other Tools (1) Graphics :: Utilities (6) Graphics :: Viewers (2) Home & Desktop (1) Home & Desktop :: Hobbies (1) Home & Education (1) Home & Education :: Foreign languages (1) Home & Education :: language (1) Home & Education :: languages (1) Home & Hobby (511) Home & Hobby :: Calendars & Planners (60) Home & Hobby :: Cataloging (2) Home & Hobby :: Collection Organizers (1) Home & Hobby :: Education (110) Home & Hobby :: Entertainment (104) Home & Hobby :: Food & Beverage (16) Home & Hobby :: Gambling (21) Home & Hobby :: Genealogy (7) Home & Hobby :: Health & Nutrition (23) Home & Hobby :: Hobbies (100) Home & Hobby :: Home Finance (59) Home & Hobby :: Home Inventory (42) Home & Hobby :: Journals & Diaries (20) Home & Hobby :: Kids & Parenting (25) Home & Hobby :: Misc. Home (114) Home & Hobby :: Other (1) Home & Hobby :: Personal Finance (2) Home & Hobby :: Religion & Spirituality (23) Home & Hobby :: Sports (30) Home & Personal (2) Home & Personal :: Cataloging (2) Home and Education (1) Home and Education :: Language (1) Home and Hobby (2) Home and Hobby :: Cataloging (2) Home and Hobby :: Collection Organizers (1) Home and Hobby :: Hobbies (1) Internet (1165) Internet :: Access Control (72) Internet :: Anti Spam (20) Internet :: ASP (8) Internet :: Browser Utilities (83) Internet :: Browsers (30) Internet :: Communication and Chat (89) Internet :: Connectivity Tools (76) Internet :: DNS Tools (19) Internet :: Download Managers (78) Internet :: Email (232) Internet :: File Sharing Tools (65) Internet :: Firewalls (36) Internet :: Flash Players (1) Internet :: FTP (36) Internet :: HTML5 Players (1) Internet :: ISPs (12) Internet :: Marketing (1) Internet :: Miscellaneous (170) Internet :: Monitoring (124) Internet :: Network Tools (158) Internet :: News Readers (10) Internet :: Online Privacy (82) Internet :: Other (1) Internet :: Pop-Up Ad Killers (14) Internet :: Promotion (59) Internet :: Radio (1) Internet :: Screenscraping (1) Internet :: Search Tools (1) Internet :: Security (172) Internet :: Social Media (1) Internet :: TCP SSL (1) Internet :: Telnet Terminals (14) Internet :: Time Synchronization (8) Internet :: Tools & Utilities (551) Internet :: Usenet Tools (3) Internet :: Video Players (1) Internet :: WAP Utilities (1) Internet :: Website Management (79) Learning Software (1) Learning Software :: Language Software (1) Mac (2) Mac :: Business (2) Mac :: Business :: Databases & Tools (2) MP3 & Audio (528) MP3 & Audio :: All-in-One Jukeboxes (18) MP3 & Audio :: Audio CD Burners (29) MP3 & Audio :: Audio Cleaners (1) MP3 & Audio :: Audio Editors (84) MP3 & Audio :: Audio Recorders (90) MP3 & Audio :: Audio Recordes (3) MP3 & Audio :: Audio Restoration (1) Mp3 & Audio :: CD & DVD Tools (1) MP3 & Audio :: Converters (194) MP3 & Audio :: MIDI Players & Tools (43) MP3 & Audio :: Misc. MP3 & Audio (142) MP3 & Audio :: MP3 Search Tools (29) MP3 & Audio :: Music Creation (59) MP3 & Audio :: Music Management (77) MP3 & Audio :: Noise Removal (2) MP3 & Audio :: Organizers (42) MP3 & Audio :: Players (104) MP3 & Audio :: Rippers & Encoders (94) MP3 & Audio :: Skins (1) MP3 & Audio :: Sound Restoration (1) MP3 & Audio :: Speech Utilities (27) MP3 & Audio :: Streaming Audio (62) MP3 & Audio :: Tag Editor (40) MP3 & Audio :: Utilities and Plug-Ins (83) MP3 & Audio :: Vinyl Restoration (1) MP3 & Audio :: Web Cam Tools (11) Mulimedia & Design (1) Mulimedia & Design :: Video & DVD Tools (1) Multimedia (2) Multimedia & Design (3) Multimedia & Design :: Illustration (1) Multimedia & Design :: Webcam Tools (2) MULTIMEDIA & GRAPHICS (1) MULTIMEDIA & GRAPHICS :: GRAPHIC CONVERSION TOOLS (1) MULTIMEDIA & GRAPHICS :: GRAPHICS EDITORS (1) Multimedia :: Authoring Tools (2) Multimedia and Design (1256) Multimedia and Design :: Animation Tools (63) Multimedia and Design :: Authoring Tools (81) Multimedia and Design :: CAD (120) Multimedia and Design :: Cataloging (45) Multimedia and Design :: Compression (41) Multimedia and Design :: Converters (366) Multimedia and Design :: Drawing (1) Multimedia and Design :: Flash Tools (21) Multimedia and Design :: Fonts & Font Tools (50) Multimedia and Design :: Illustration (89) Multimedia and Design :: Image Analyze (1) Multimedia and Design :: Image Editing (272) Multimedia and Design :: Image Viewers (124) Multimedia and Design :: Miscellaneous (202) Multimedia and Design :: Organizers (66) Multimedia and Design :: Painting (1) Multimedia and Design :: Presentations (94) Multimedia and Design :: Screen Capture (111) Multimedia and Design :: Utilities (356) Multimedia and Design :: verifiers (1) Multimedia and Design :: Video Editors (175) Multimedia and Design :: Video Players (124) Multimedia and Design :: Video Recorders (106) Multimedia and Design :: Video Tools (1) Music (1) Music :: Education (1) Network (1) Network & Internet (14) Network & Internet :: Browser Tools (1) Network & Internet :: File Sharing & Peer to Peer (1) Network & Internet :: File Sharing/Peer to Peer (6) Network & Internet :: FTP Clients (3) Network & Internet :: Other (2) Network & Internet :: Other :: File & Disk Management (1) Network & Internet :: Search/Lookup Tools (1) Network :: Active Directory Manager (1) Network :: Active Directory Reporter (1) Newsgroups (17) Newsgroups :: Image Browsers (6) Newsgroups :: News Readers (7) Newsgroups :: Servers (6) Office Applications (7) Office Applications :: Calendar/Scheduling (2) Office Applications :: Editors (2) Office Applications :: File Managers (1) Office Applications :: Misc. (4) Office Applications :: Spreadsheets (2) Other (5283) Other :: Empty (1856) Other :: Finances & Business (1) Other :: Fixed (742) Other :: Uncommon (3223) Personal Interest (1) Personal Interest :: Hobbies (1) Photo (1) Photo & Graphic (1) Photo & Graphic :: Editors (1) Photo & Graphic :: Editors & Utils (1) Photo & Graphic :: Miscellaneous (1) Photo :: Image Editing (1) Programming (772) Programming :: .NET (150) Programming :: ActiveX (45) Programming :: Bug Trackers (11) Programming :: C & C++ & C# (156) Programming :: calendar calculations (1) Programming :: CGI Tools (2) Programming :: Components and Libraries (261) Programming :: Copy Protection (1) Programming :: Databases (2) Programming :: Databases & Networks (129) Programming :: Debugging (18) Programming :: Delphi (37) Programming :: Distribution Centre Management (1) Programming :: encode/decode (1) Programming :: Enterprise Data Visualization (1) Programming :: Enterprise Resource Planning (1) Programming :: Field Service Management (1) Programming :: Firebird (1) Programming :: FreePascal (2) Programming :: Help Authoring Tools (19) Programming :: holiday calculations (1) Programming :: IDEs & Coding Utilities (86) Programming :: Installers and Uninstallers (14) Programming :: Interbase (1) Programming :: Internet Protocol (1) Programming :: Java (86) Programming :: JavaScript (59) Programming :: Kanban Board (2) Programming :: Lazarus (2) Programming :: library code (1) Programming :: Logistics (1) Programming :: Management and Distribution (31) Programming :: Managemet and Distribution (1) Programming :: Microsoft Access (3) Programming :: Microsoft SQL Server (1) Programming :: Miscellaneous (209) Programming :: MySQL (1) Programming :: Oracle (1) Programming :: Postgre SQL (1) Programming :: Python (16) Programming :: Reference & Tutorials (16) Programming :: Setup Utilities (26) Programming :: Source Code (101) Programming :: Source code generator (1) Programming :: SQL (48) Programming :: SQL Anywhere (1) Programming :: Sybase (1) Programming :: Text Editors (1) Programming :: Tools and Editors (195) Programming :: Utilities (1) Programming :: Visual Basic (113) Programming :: Warehouse Management (1) Programming :: Winsock (1) Science (1) Science :: satellite (1) Science :: satellite :: tracking (1) Security & Privacy (5) Security & Privacy :: Anti-Spam & Anti-Spy Tools (1) Security & Privacy :: Covert Surveillance (2) Security & Privacy :: Encryption Tools (2) Security & Privacy :: Other (1) Security Tools (618) Security Tools :: Anti-Malware (2) Security Tools :: Application Patching (1) Security Tools :: backup (1) Security Tools :: Desktop Monitors (36) Security Tools :: File Removers (59) Security Tools :: File Security (152) Security Tools :: Key Loggers (33) Security Tools :: Online Privacy (123) Security Tools :: Password Generators (47) Security Tools :: Password Managers (90) Security Tools :: Password Recovery (161) Security Tools :: PC Access Control (96) Security Tools :: Personal Firewalls (37) Security Tools :: System Lockers (39) Security Tools :: Traffic Filtering (2) Security Tools :: Virus Removers (49) Security Tools :: Virus Scanners (57) Security Tools :: VPN (4) Servers (1) Servers :: Firewall & Proxy Servers (1) Shell & Desktop Enhancements (300) Shell & Desktop Enhancements :: Cursors (1) Shell & Desktop Enhancements :: Font Tools (15) Shell & Desktop Enhancements :: Fonts (12) Shell & Desktop Enhancements :: Icon Tools (18) Shell & Desktop Enhancements :: Icons (9) Shell & Desktop Enhancements :: Personal Tech Solutions (39) Shell & Desktop Enhancements :: Screensaver Utilities (15) Shell & Desktop Enhancements :: Screensavers (75) Shell & Desktop Enhancements :: Shell & Desktop Management (56) Shell & Desktop Enhancements :: Skins (7) Shell & Desktop Enhancements :: Start-up Screens (8) Shell & Desktop Enhancements :: Themes (7) Shell & Desktop Enhancements :: Utilities (152) Shell & Desktop Enhancements :: Wallpaper (20) Software (1) Software :: Free Software (1) Sports (1) Sports :: Scoreboards (1) System Utilities (43) System Utilities :: Automation (1) System Utilities :: Automation Tools (3) System Utilities :: Backup (1) System Utilities :: Backup & Restore (9) System Utilities :: Configuration (2) System Utilities :: File & Disk Management (3) System Utilities :: File Compression (3) System Utilities :: File Management (6) System Utilities :: Misc. Utilities (5) System Utilities :: Monitors (2) System Utilities :: Other (3) System Utilities :: Printer (2) System Utilities :: Printing (1) System Utilities :: Security (8) System Utilities :: System Maintenance (3) System Utilities :: Taskbar (1) System Utilities :: Undelete (2) Technical (1) Technical :: Computing (1) Unerase (1) Unerase :: Utilities (1) Utilities (2482) Utilities & Drivers (1) Utilities & Drivers :: Shell Tools (1) Utilities & Hardware (2) Utilities & Hardware :: System Utilities (2) Utilities :: Anti-bloatware (1) Utilities :: Antivirus (42) Utilities :: Automation (1) Utilities :: Backup (399) Utilities :: Clipboard Tools (1) Utilities :: Data Recovery (1) Utilities :: Databases (1) Utilities :: disk cleanup software (1) Utilities :: Disk space analysis (1) Utilities :: Disk Space Management (1) Utilities :: Drive space analysis (1) Utilities :: Drive space management (1) Utilities :: Drivers (32) Utilities :: File & Disk Management (881) Utilities :: File age analysis (1) Utilities :: File Compression (97) Utilities :: File editing (1) Utilities :: File size analysis (1) Utilities :: File space analysis (1) Utilities :: File Space Management (1) Utilities :: Folder age analysis (1) Utilities :: Folder analysis (1) Utilities :: Folder size analysis (1) Utilities :: Hard Disk Utilities (1) Utilities :: Installation Monitoring (1) Utilities :: IS/IT Solutions (179) Utilities :: Keyboard (1) Utilities :: Launchers (51) Utilities :: Miscellaneous (569) Utilities :: Mouse & Keyboard (1) Utilities :: Mouse and Keyboard (1) Utilities :: Mouse and Keyboard Utilities (1) Utilities :: Mouse/Keyboard Tools (1) Utilities :: Network Utilities (209) Utilities :: Networking (1) Utilities :: Obsolete file removal (1) Utilities :: Obsolete folder removal (1) Utilities :: Optimizer (1) Utilities :: Password Recovery (166) Utilities :: Ping & Trace Tools (15) Utilities :: Printers (47) Utilities :: Security (1) Utilities :: Security & Encryption (391) Utilities :: Security :: Password Managers (1) Utilities :: Shutdown Tools (26) Utilities :: Synchronization (64) Utilities :: System Diagnostics (115) Utilities :: System Optimizers (150) Utilities :: System Utilities (1089) Utilities :: Uninstallers (34) Video (4) Video & Audio (1) Video & Audio :: Players (1) Video :: Editors (3) Video :: Players (4) Web Authoring (4) Web Authoring :: Tools & Utilities (2) Web Authoring :: Web Utilities (1) Web Authoring :: WYSIWYG Editors (1) Web Development (423) Web Development :: ASP (49) Web Development :: CGI (4) Web Development :: Content Management Systems (1) Web Development :: E-commerce (47) Web Development :: Flat file CMS (1) Web Development :: HTML (1) Web Development :: HTML Conversion Tools (40) Web Development :: HTML Editors (65) Web Development :: HTML Utilities (1) Web Development :: HTML Validators (8) Web Development :: Java & Java Script (70) Web Development :: link checkers (1) Web Development :: Log Analyzers (9) Web Development :: Miscellaneous (138) Web Development :: Other (1) Web Development :: PHP (54) Web Development :: Reference & Tutorials (16) Web Development :: Site Administration (3) Web Development :: Site Management (65) Web Development :: Site Mappers (10) Web Development :: Site Promotion (48) Web Development :: Site Security Tools (14) Web Development :: Style Sheets (16) Web Development :: Web Design Utilities (113) Web Development :: Web Servers (51) Web Development :: XML (22) Web Development :: XML\/CSS Tools (2) Web Surfing (2) Web Surfing :: Security (2) WebDevelopment (2) WebDevelopment :: Log Analysers (2) Windows (12) Windows :: Business (1) Windows :: Business :: Accounting & Finance (1) Windows :: Business :: Business Finance (1) Windows :: Computer Utilities (1) Windows :: Developer Tools (1) Windows :: Developer Tools :: Database (1) Windows :: Development (1) Windows :: Graphic Apps (1) Windows :: Graphic Apps :: CAD (1) Windows :: Graphics (2) Windows :: Graphics :: Paid (2) Windows :: IT/IS (1) Windows :: System Utilities (1) Windows :: System Utilities :: File & Disk Management (1) Windows :: Utilities (1) Windows :: Utilities :: File & Disk Management (1) Windows :: Video Tools (2)
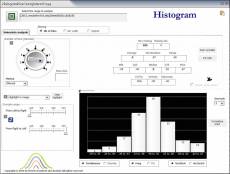
HistogramPlus 1.2
Компания: metrics institute Страна: Israel, Israel, Zichron Член ASP: Нет Web сайт компании: http://www.excel-premiumutilities.com Сайт программы: http://www.excel-premiumutilities.com О приложении: http://www.excel-premiumutilities.com/#!statistical/cwgk Видео: https://youtu.be/kTh2qZ8FstY Автор: avi benita Email продаж: avibenita84@gmail.com Email техподдержки: avibenita84@gmail.com Тип лицензии: Условно-бесплатная Класс: Business::Office Suites & Tools Специфика: Категории: Business & Finance :: Spreadsheets, Business & Finance :: Office Tools, Business & Finance :: Utilities Платформа: Windows ОС: Win2000, WinXP, Win7 x32, Win7 x64, Windows 8, WinServer, WinOther, WinVista, WinVista x64 Системные требования: Noting specific Язык: English Ограничения: Range size to analyse
Ключевые слова: Histogram, excel histogram, excel frequency, excel statistics, normal distribution, excel data analysze, p-p plot
Сообщить о VT
~49.00$
Дата Версия Статус История выпусков 01.04.2015 1.2 New Release New release
Разрешения на распространение: The free version may be freely distributed
Лицензионное соглашение с конечным пользователем END-USER LICENSE AGREEMENT FOR HistogramPlus (http://www.excel-premiumutilities.com), a product developed by Metrics Institute (Avi Benita)
Рейтинг:
Назад Наверх
Февраль 2026
Пн Вт Ср Чт Пт Сб Вс
1
2 3 4 5 6 7 8
9 10 11 12 13 14 15
16 17 18 19 20 21 22
23 24 25 26 27 28
21 февраля 2026 года, суббота
Сейчас на сайте
Гостей: 45


 Галерея


 HistogramPlus 1.2